.png)
This is my one page resume
It illustrates my skills and work experience
.jpg)
I love analysing data
and getting insight from data

l enjoy building data models that helps businesses, analyze information immediately and make fast, informed decisions.
You can visit my LinkedIn page here.
My datastack are: Power BI, Tableau, Spreadsheet, Visualization
..
These are some of my most interesting project on Data Cleaning & Transformation, Power Bi, Tableau
It illustrates my skills and work experience
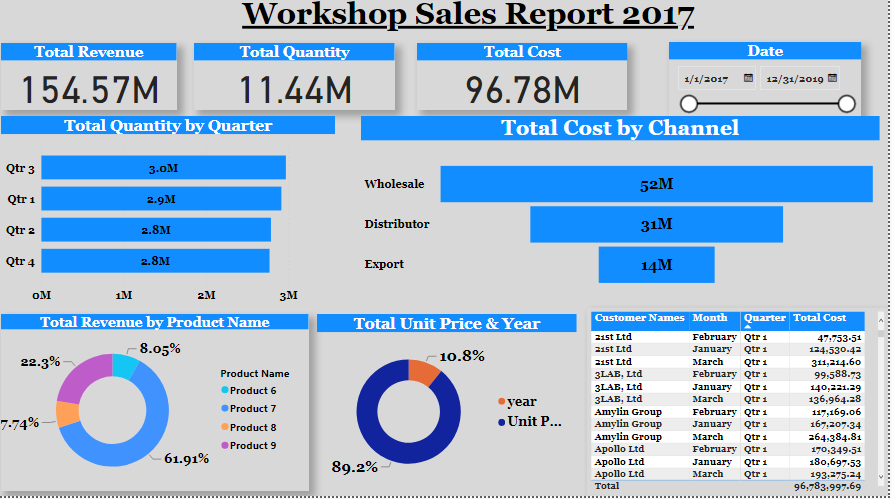
This dashboard is a workshop sales report for 2017. The analysis shows the customer name, month, quarter, and the total revenue of customers who patronized the workshop in 2017. We have the total revenue, total cost, total quantity , and total revenue by month. ln this insight the 3rd quarter has the highest total quantity for the year 2017. I used the the excel function like SUM, COUNT, SUMX to get the total revenue. The total revenue, total quantity by quarter, total unit cost.

This Sales Excel dashboard shows the sales trend in millions from January to June, the month of march and april has the highest sales trend while in January we had in the lowest. In this insight l illustrate the top 3 state in revenue, top 10 product by revenue, total revenue, no of maufacturers, average revenue.
This dashboard illustrate the cholera outbreak in Stockholm in August 1853.The analysis shows the death count of people that died from cholera, the gender status of male and female, Age range count of people that had cholera